South Beach · Miami area
Flamingo South Beach Miami Condos for Sale & Rent
Available now
4 for sale · 11 for rent
For sale
4 active MLS listings, ordered by asking price.
For rent
11 active MLS listings, ordered by asking price.
| Unit | Price | Beds | Baths | Sq ft | $/sq ft | Days on market |
|---|---|---|---|---|---|---|
| 1236S | $2,650/mo | Studio | 1 | 461 | $6 | 0 |
| 1436S | $3,000/mo | Studio | 1 | 461 | $7 | 71 |
| 1002S | $3,300/mo | 1 | 1 | 923 | $4 | 98 |
| 1542S | $3,300/mo | 1 | 1 | 728 | $5 | 1 |
| 1220S | $3,500/mo | 1 | 1 | 729 | $5 | 26 |
| 1268S | $3,850/mo | 2 | 1.5 | 1,020 | $4 | 160 |
| 1428S | $4,250/mo | 2 | 2 | 1,072 | $4 | 24 |
| 846S | $5,650/mo | 2 | 2 | 1,069 | $5 | 358 |
| 1534S | $5,650/mo | 2 | 2 | 1,062 | $5 | 513 |
| 522S | $7,000/mo | 2 | 2 | 1,088 | $6 | 804 |
| 1114S | $9,900/mo | 3 | 3 | 2,029 | $5 | 107 |
Building details
- Architect
- Stantec Miami
Residence details
- 1504 Bay Road, Miami Beach, FL 33139 is the official property-site address
As of November 8, 2026, Flamingo South Beach Miami has 4 condos for sale from $249,900 to $1,749,000, with a median asking price of $425,000. 11 condos for rent from $2,650 to $9,900/mo, with a median asking rent of $3,850/mo. Median reported HOA is $783/mo. In the last 12 months, 15 MLS sales closed at a median $616 per square foot and a median 77 days on market. How our data works
1504 Bay Road, Miami Beach, FL, 33139
Flamingo South Beach condominiums in South Beach, Miami.
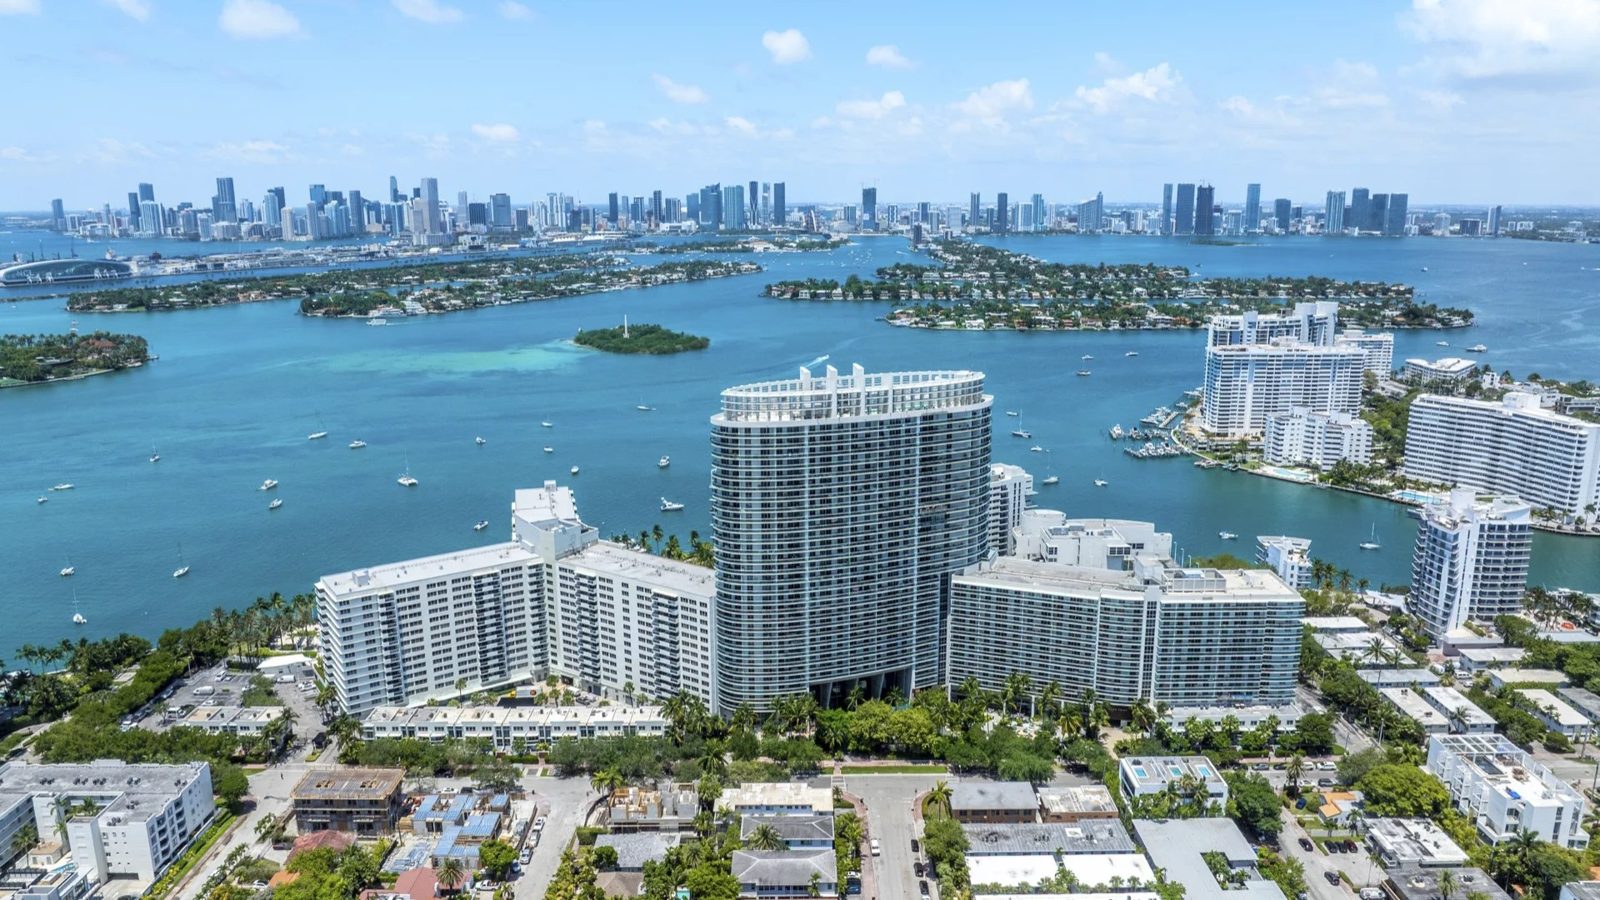
Photo: Flamingo South Beach · Official building website
Flamingo South Beach is publicly presented at 1504 Bay Road in Miami Beach.
Explore Flamingo South Beach
Request current availability, comparable residences, or a private consultation.
How showings workContinue your Flamingo South Beach research
- Place Flamingo South Beach alongside nearby Miami condominium options in its neighborhood.
- View the current sale and rental listings matched to Flamingo South Beach.
- Use the Flamingo South Beach listing table to compare unit, condition, and current price.
Quick facts
- Median closed $/sq ft (12 months)
- $616 (15 sales)
Price per sq ft by year (MLS aggregate)
| Year | Median closed $/sq ft | Number of closed sales |
|---|---|---|
| 2021 | $371 | 45 |
| 2022 | $515 | 55 |
| 2023 | $501 | 21 |
| 2024 | $556 | 21 |
| 2025 | $571 | 13 |
| Trailing 12 months | $616 | 15 |
Source: Miami MLS closed sales, aggregated by CondoInvestMiami · Updated
Sales by period
| Period | Closed sales | Median closed $/sq ft | Median closed price |
|---|---|---|---|
| 3 months | 6 | Not enough sales | Not enough sales |
| 6 months | 6 | Not enough sales | Not enough sales |
| 12 months | 15 | $616/sq ft | $508,000 |
| 24 months | 26 | $592/sq ft | $530,000 |
Median closed metrics require at least 10 matched closed sales and at least 10 eligible observations for each metric in the stated period.
Pending
2 units are pending (under contract): 264S, 830S.
Market snapshot
A current snapshot based only on active MLS listings matched to this building. Sale and rental figures are shown separately because their pricing is not comparable.
Updated November 8, 2026
For sale
- Active listings
- 4
- Median asking price / sq. ft.
- $668/sq. ft.
- Asking price range
- $249,900–$1,749,000
- Published HOA range
- $547–$2,640/mo
4 active for sale listings are reflected in this snapshot. The current price position is $249,900–$1,749,000, with a median asking value of $668 per square foot. Published HOA figures are $547–$2,640/mo.
For rent
- Active listings
- 11
- Median monthly rent / sq. ft.
- $5 per sq ft per month
- Monthly asking price range
- $2,650/mo–$9,900/mo
- Published HOA range
- Not published in current listings
11 active for rent listings are reflected in this snapshot. The current price position is $2,650/mo–$9,900/mo, with a median asking value of $5 per sq ft per month. Monthly figures are not compared with purchase prices.
Market data
- Closed sales, 12 months
- 15
- Median closed $/sq ft
- $616
- Median days on market
- 77 days
- Median sale-to-list ratio
- 95.7%
Source: MLS closed sales, 2025-11-08 to 2026-11-07 (inclusive). How our data works · Full Miami condo market data
Active inventory and market data
- Closed sales, 12 months
- 15
- Closed sales, 24 months
- 26
- Active for sale
- 4
- Pending / under contract
- 2
- Months of supply
- 3.2 months
- Median days on market — active for-sale listings
- 2.5 days
Active for sale × 12 ÷ closed sales (12 months): 4 × 12 ÷ 15. n=15 closed sales; no minimum sample threshold.
n=4 current active for-sale listings with valid nonnegative MLS days on market. Includes ComingSoon; excludes rentals, pending and closed sales. Small samples are shown.
Closed-sale medians — 24 months
- Median closed $/sq ft, 24 months
- $592/sq ft
- Median closed price, 24 months
- $530,000
- Median closed-sale days on market, 24 months
- 123 days
- Median sale-to-list ratio, 24 months
- 94.6%
n=26 eligible observations
n=26 eligible observations
n=26 eligible observations
n=26 eligible observations
24-month medians require at least 10 matched closed sales and 10 eligible observations per metric. Window: 2024-11-08 to 2026-11-07 (inclusive).
Source: current MLS inventory and aggregated closed sales for this building. How our data works
Unit lines from current listings
Current active and pending MLS listings only. Lines use the last 2 numeric unit digits, keeping tower letters separate. This is a listing sample, not a complete building floor plan.
| Line / tower | Beds | Living area (sq ft) | Observed floors | Listings | Floor methodology |
|---|---|---|---|---|---|
| 02 (S) | 1 | 923 | Not reported | 1 | Not reported |
| 10 (S) | 0 (studio) | 472 | Not reported | 1 | Not reported |
| 14 (S) | 3 | 2,029 | Not reported | 2 | Not reported |
| 20 (S) | 1 | 729 | Not reported | 1 | Not reported |
| 22 (S) | 2 | 1,088 | Not reported | 1 | Not reported |
| 28 (S) | 2 | 1,072 | Not reported | 1 | Not reported |
| 30 (S) | 1 | 722 | Not reported | 1 | Not reported |
| 34 (S) | 2 | 1,062 | Not reported | 1 | Not reported |
| 36 (S) | 0 (studio) | 461 | Not reported | 2 | Not reported |
| 42 (S) | 1 | 728 | Not reported | 1 | Not reported |
| 46 (S) | 2 | 1,069 | Not reported | 1 | Not reported |
| 58 (S) | 1 | 788 | Not reported | 1 | Not reported |
| 64 (S) | 1 | 731 | Not reported | 1 | Not reported |
| 68 (S) | 2 | 1,020 | Not reported | 1 | Not reported |
| 72 (S) | 0 (studio) | 454 | Not reported | 1 | Not reported |
Floors shown here are reported by MLS. No floors have been inferred from unit numbers in this sample.
Beds and living areas are reported by MLS. No sold-unit details or prices are included.
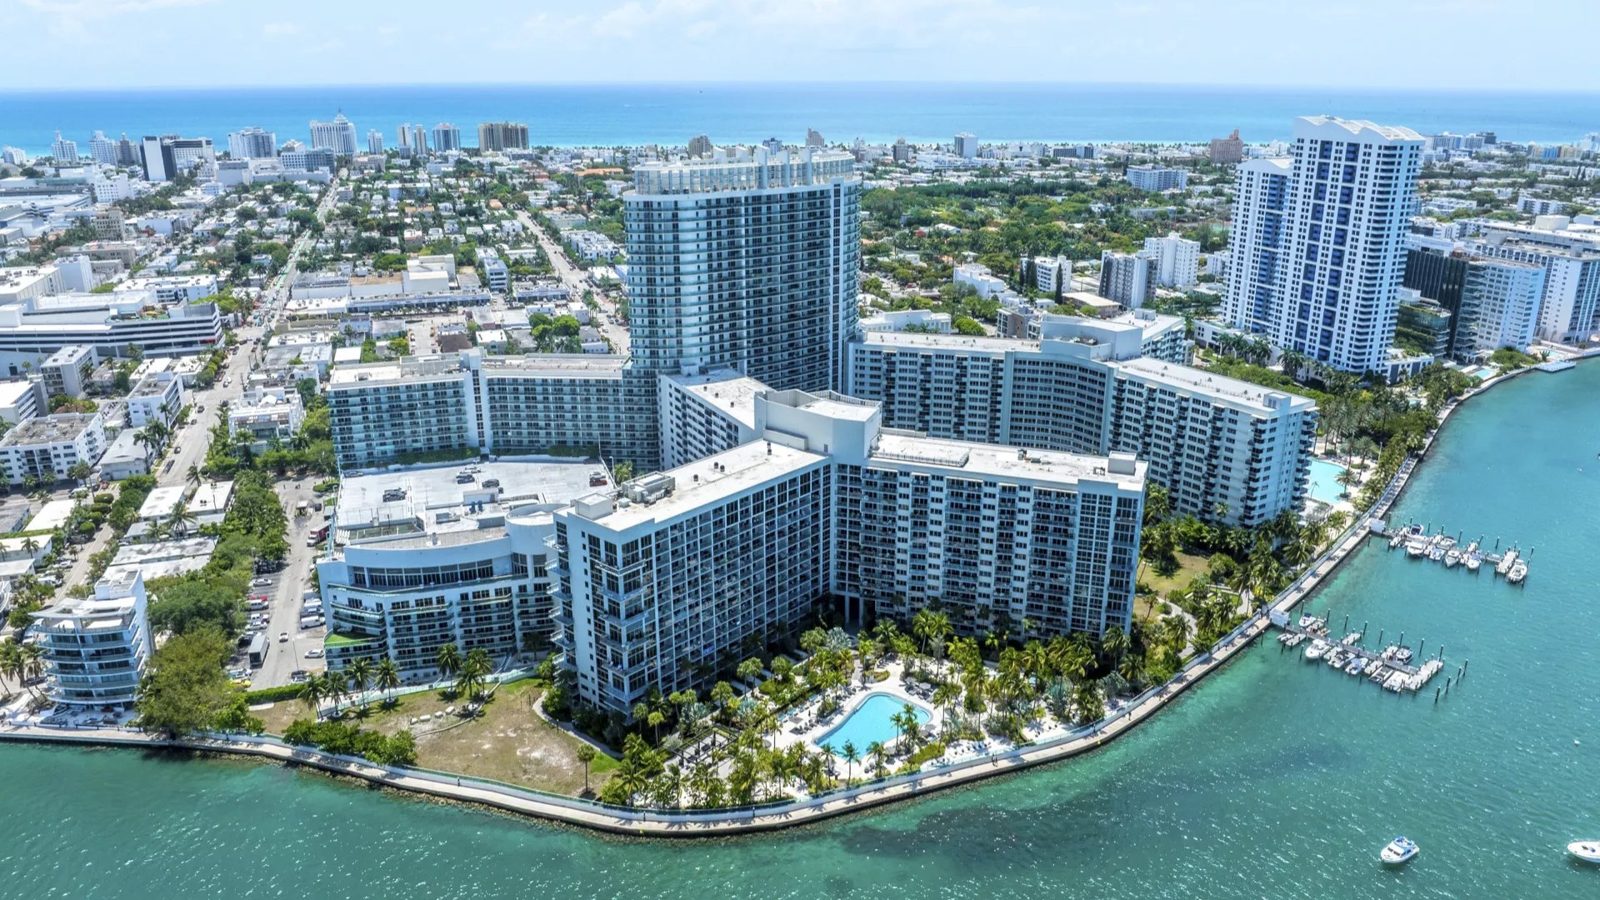
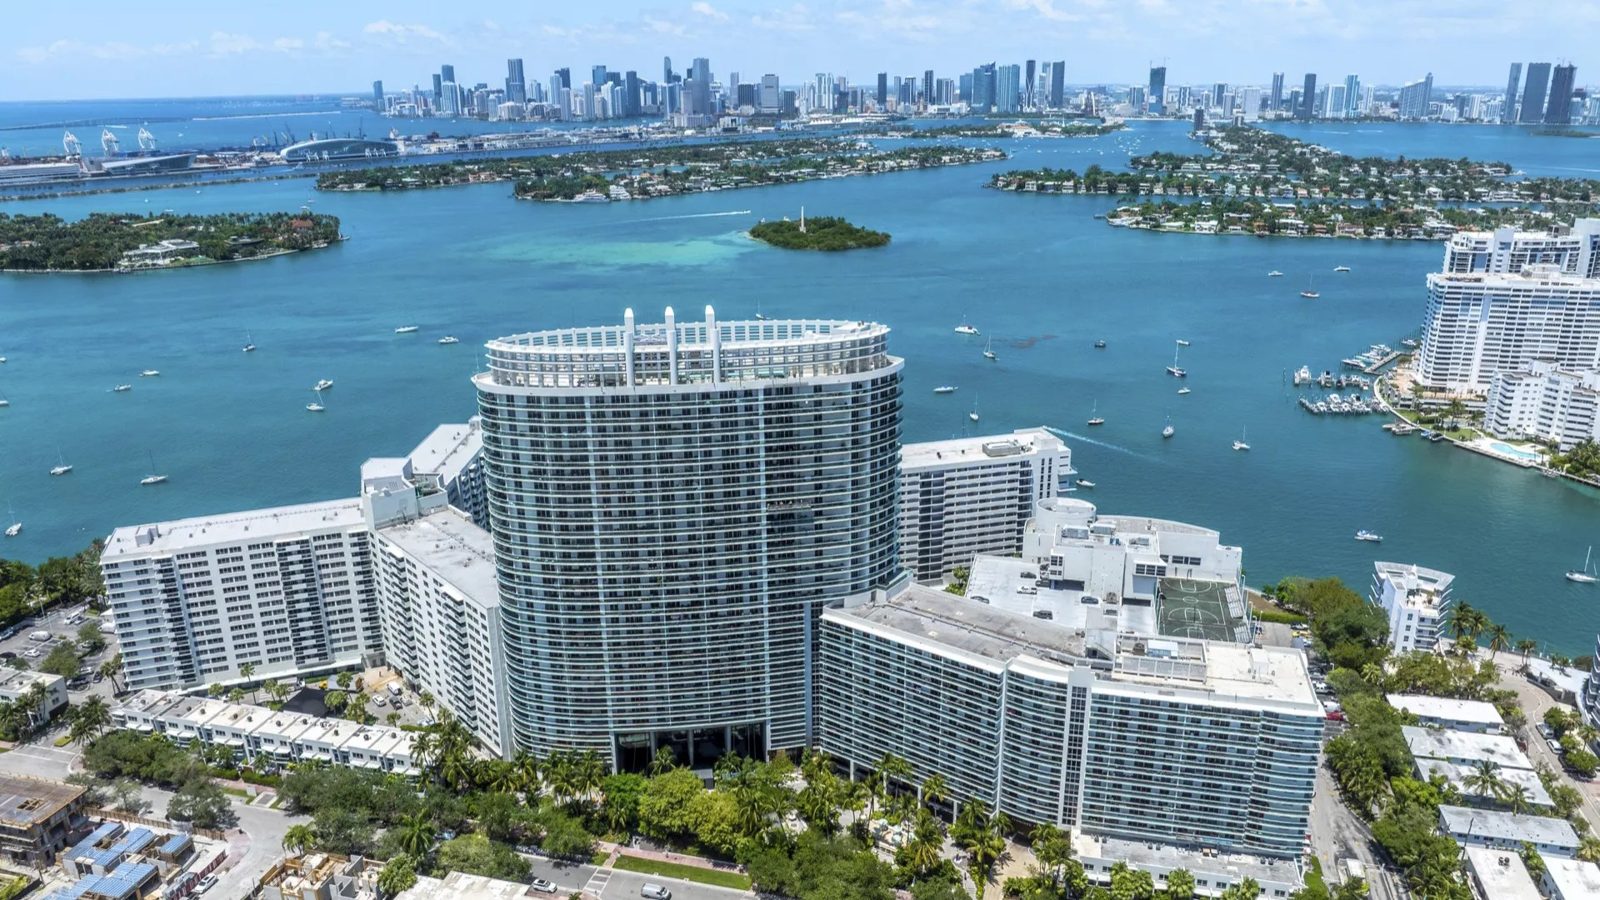
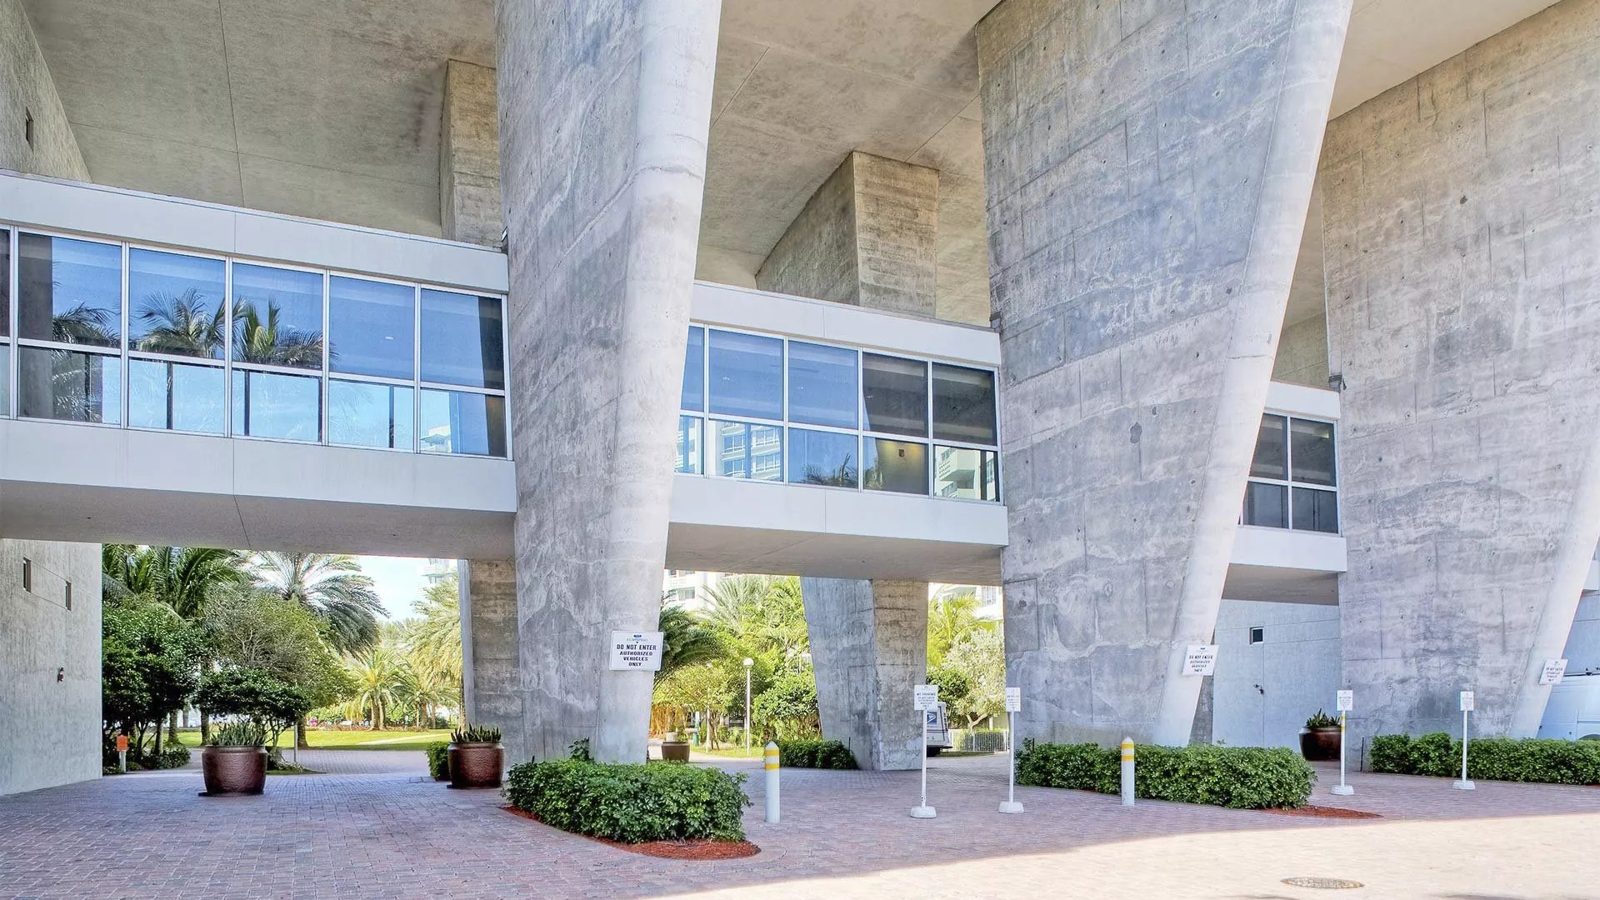
Building gallery

Building location
1504 Bay Road, Miami Beach, FL, 33139
Building records
- Flood zone
- AESource: FEMA National Flood Hazard Layer — effective Flood Hazard Zones · Checked
- Hurricane evacuation zone
- BSource: Miami-Dade County — Hurricane Evacuation Zone / Storm Surge Planning Zone · Checked
- Year built
- 1960Source: Miami-Dade Property Appraiser — official current residential parcel · Checked
Show all records
- DBPR condominium units
- Not yet checkedSource: Florida DBPR · Not yet checked
- Milestone / 40–50 year recertification
- Not yet checkedSource: Local building department · Not yet checked
- Open building violations / structure cases
- 1 open building/structure magistrate case(s) in official address search (not a whole-building finding)Source: City of Miami Beach — open building/structure magistrate cases · Checked
- FHA project approval
- Not yet checkedSource: HUD FHA condominium approval list · Not yet checked
- VA project approval
- Not yet checkedSource: VA condominium report · Not yet checked
- DBPR association registration
- Not yet checkedSource: Florida DBPR condominium association registration · Not yet checkedDBPR project status does not confirm current association registration compliance.
- Rental rules reported in listings
- Lease term: LessThan1Year most frequently reported; reported values: LessThan1Year · TwelveMonths. Pets: Conditional,Yes most frequently reported; reported values: CatsOk,DogsOk,PetFee,Yes · Conditional,PetFee,Yes · Conditional,Yes · DogsOk,No,Yes · No. As reported in 15 active listingsSource: Active Miami MLS listings · Checked Sample: 15
- Special assessments reported in listings
- Not yet checkedSource: Active Miami MLS listings · Not yet checked
- HOA per sq ft
- $1.24 per sq ft per month · n=4Source: Active Miami MLS listings · Checked Sample: 4
These records come from public sources and active MLS listings on the dates shown. They do not replace the association's budget, reserve study (SIRS), milestone inspection report, insurance and minutes, which a buyer should request before signing.
What does the 12-month MLS history show?
In the last 12 months, 15 MLS sales closed at a median $616 per square foot and a median 77 days on market.
Search current MLS listings for Flamingo South Beach · View building profile